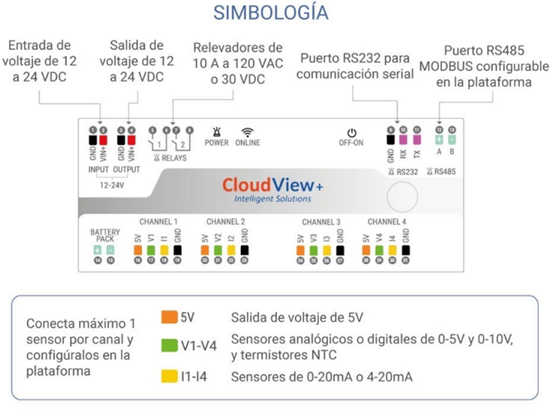
- In the pins marked with this label (14,19,24 and 29) you will find 5V output.
- On pins 16, 21, 25 and 31 we have an input capable of receiving a 0-10 V analog signal.
- They are digital reception pins (15,20,25 and 30).
- These pins receive a 4-20mA ammeter signal (17,22,27 and 32)
-Pins 9 and 10.- RS232 serial communication protocol connection, which works at a short distance and can establish Ethernet connectivity.
-Pins 12 and 13.- Through the RS485 communication signal it is possible to configure inputs with ModBus RTU protocol.
Sensor configuration
In the first instance, click on "Sensors" to configure your inputs. Click on “Add” to start configuring your first type of sensor.
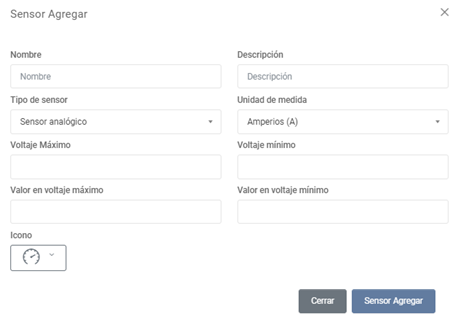
Starting by naming the sensor, in "Description" you can add something referring, brand or manufacturer, for example, in "Sensor type" select the appropriate one from the variety of options: " analog sensor", "current sensor" or “NTC thermistor”
In the "Unit of measure" section, a list of options is displayed for you to select the unit in which the relevant data is received. Amps (A), BAR (BAR), Boolean (Boolean), Status Code, Decimal, Integer ( int ), Date, Geolocation, Degrees Celsius (°C), Degrees Fahrenheit (°F), Hours ( Hr ), Minutes , Percentage (%), Power (kW), PSI (PSI), Seconds ( Sec ), Text, Voltage (V).
We continue to introduce the maximum voltage value supported by the sensor, as well as the minimum.
The "Value at maximum voltage" and "Value at minimum voltage" introduce the measurement range in which the sensor works with respect to its unit of measurement.
To finish, select the icon you want to assign. This action is repeated for each sensor connected to CloudView +.
Set slaves
Once the sensors have been set up, we proceed to add the slave devices (this is in case it requires establishing a ModBus communication , otherwise it can be omitted). We go to the "Slaves" section, then "Add", we establish the names, a description if desired, and finally we select the address of the slave (the one marked by your device that it will monitor).
To establish a communication of the parameters that we want to obtain from the ModBus device , it is necessary to have the record sheet and have selected those desired to monitor.
Located in “Slaves>>Add”, once the reference of the slave device has been added, a form like the following will be displayed:
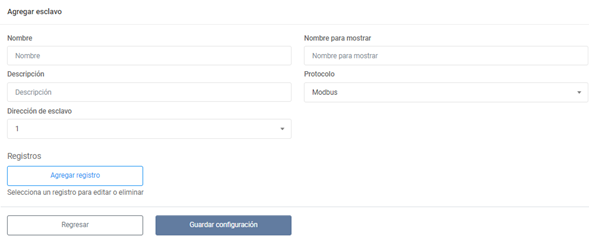
It is important that both your Modbus equipment and the platform have the same slave address number so that a connection can be established. To add the list we select "Add record", the following questionnaire will be displayed:
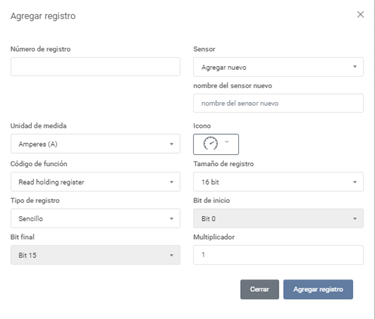
Basically, it is transferring the information from the record sheet to this format one by one. If there is a record divided into two, this means that the record size is 32 bits.
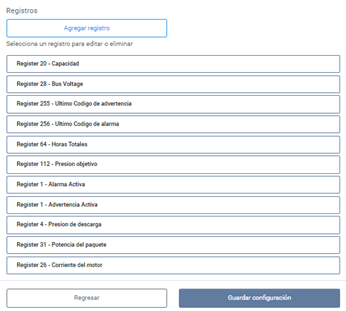
The previous image is representative of how the list of records is shown once they have been set. When finished, let's not forget to save the configuration.
CloudView+ devices
Now we move on to the next one, which is the input configuration, which is done in " CloudView + Devices", here we must assign the previously configured sensors to their corresponding input. Depending on the type of sensor, its input is selected by clicking on "configuration" according to the desired input, according to its physical connections. We have already seen which channel and pins correspond in each case.
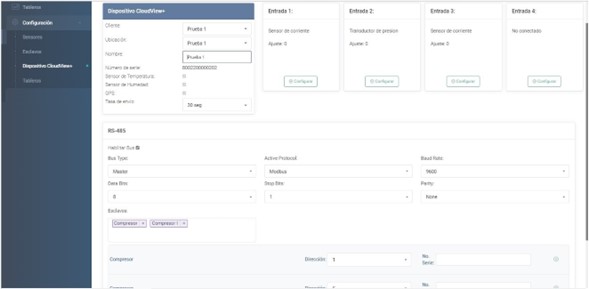
In almost having slave devices, we must enable the Bus, the configuration requests data that is also explicit in the device registration sheet.
Boards
We already have entered our sensors, assigned their inputs, set the ModBus channels , as a final step we only have to design and create our display board. Click on "Boards", and followed by "Add". The following view will be displayed:
Your dashboard gives you the option of sectioning the grouping of your widgets and naming each section to your liking and convenience. Click on "Search records"
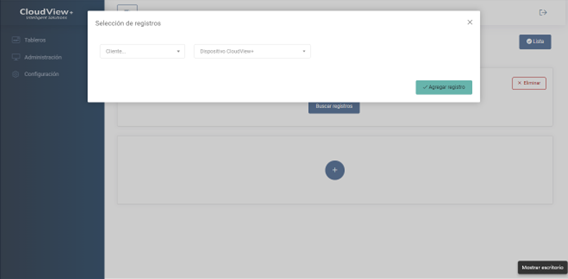
We select the user, and in "Cloudview+ Device", a list of the series of his equipment will appear, he selects it and he can decide which readings will be in that section as shown below:
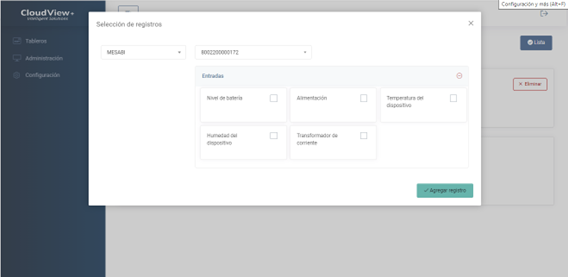
We select the desired ones and click on "Add record". If you need to add more sections, simply click "+" and repeat the process.
Once finished, we hit "Ready". It will ask us to select the user, location, and the users that will have access to that dashboard.
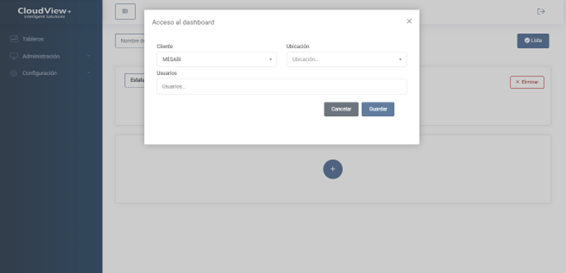
We click on "Save".
Now, when we go to read "Display panel" blog to the next, we will be able to visualize our board.