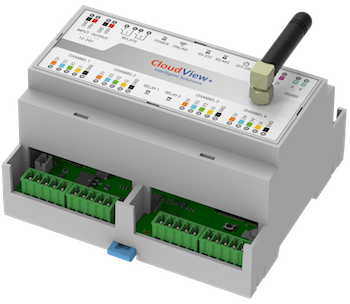
Welcome to CloudView +, thank you for your trust.
As a first step, you receive an email. It is necessary to check if it appears in your “spam” tray, which may be the case. Your message will appear as close to the following as possible:
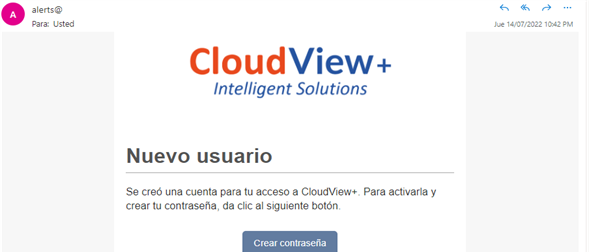
It is required to continue with the steps indicated in the email, you will be redirected to the platform and you will establish your password for your next logins.
When you successfully log in with your username and password at cloudviewplus.com, your screen will look like this:
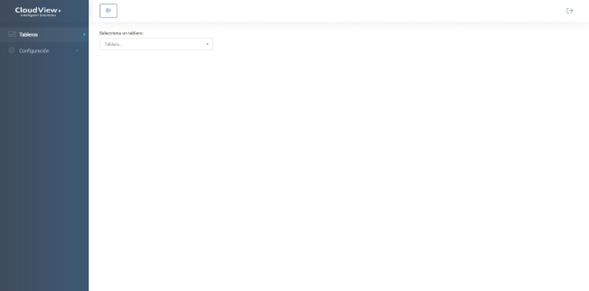
Locating ourselves there and to start creating your board, it is necessary to display the "Configuration" section in the middle left side part, where it is shown chronologically how the configuration of your board will progress.
Dashboards
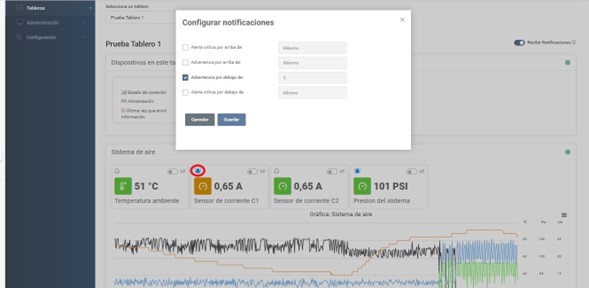
Having the view in boards, we will be able to visualize each created board that belongs to us or we have access to, an example of how we can appreciate it is the image below.
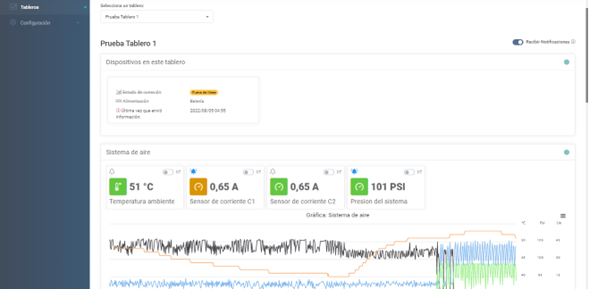
As we can see, in the first instance we have information on the status of the hardware device.
Next, the section where you selected your main parameters and in which a default graph is created.
Finally, an important part to have the alarms in your mailbox is to verify that your parameters have the bell turned on and to know in which ranges they are configured for the activation of the alert, we can see this by clicking on the bell icon, will be shown your screen as follows:
Now, you are free to explore your system parameters and status in real
time, with graphing options. In the first graph you will see it is with respect
to the points that you consider most critical for a more immediate analysis and
evaluation. Below that you will find the rest of your parameters that you can
graph by activating each one for up to a maximum of seven days.